Power BI Visual
Time Intelligence Bar Chart
A free Power BI time intelligence visual for period comparisons, trend insight, and reporting-ready analysis.
Built forFinance, Sales, Ops
PeriodsYoY, QoQ, MTD, variance
AccessFree forever
Free forever•No license key•Ready for Power BI
01Visual
FREEForever
0Cost
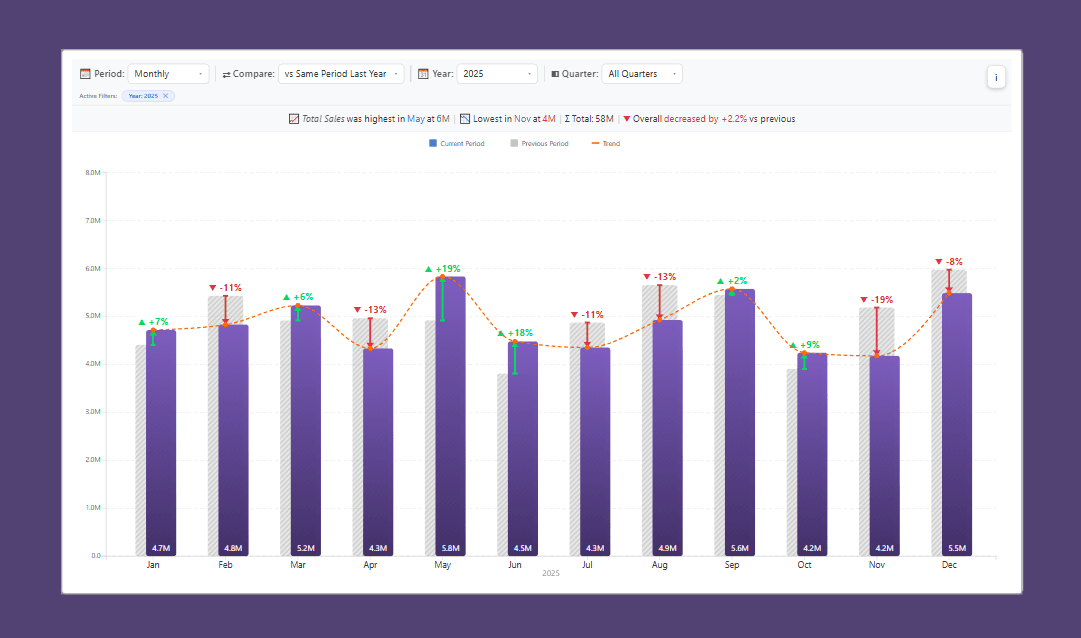
Overview
One visual. More time insight.
▦
Time Intelligence
Compare periods, focus on YoY, QoQ and MTD, and build faster business narratives with consistent chart logic.
↔
Flexible Analysis
Use monthly, quarterly, year-to-date and historical comparisons with clean format-pane configuration.
✦
Documentation
Use the visualization documentation page to understand the chart structure, field mapping, and product strategy.
Features
Time intelligence features built for reporting teams
01Monthly, quarterly, yearly comparisonsIncluded
02Download-ready documentationIncluded
03No license key requiredIncluded
04Free forever$0
Access
Free visual, no subscription required
Free Forever
$0
- All core time intelligence features
- Format pane configuration
- Keyboard and accessibility support
- Documentation and support resources
Use Cases
Ideal for teams working with trend, variance, and period-based reporting
📊
Finance
Track revenue, expense, and variance patterns across monthly or quarterly cycles.
📈
Sales
Compare current performance to previous periods and highlight seasonal shifts.
⚙️
Operations
Review volume, quality, and output trends across multiple reporting cycles.
Time Intelligence Bar Chart