Kill your 47 time intelligence DAX measures.
One visual. Zero code.
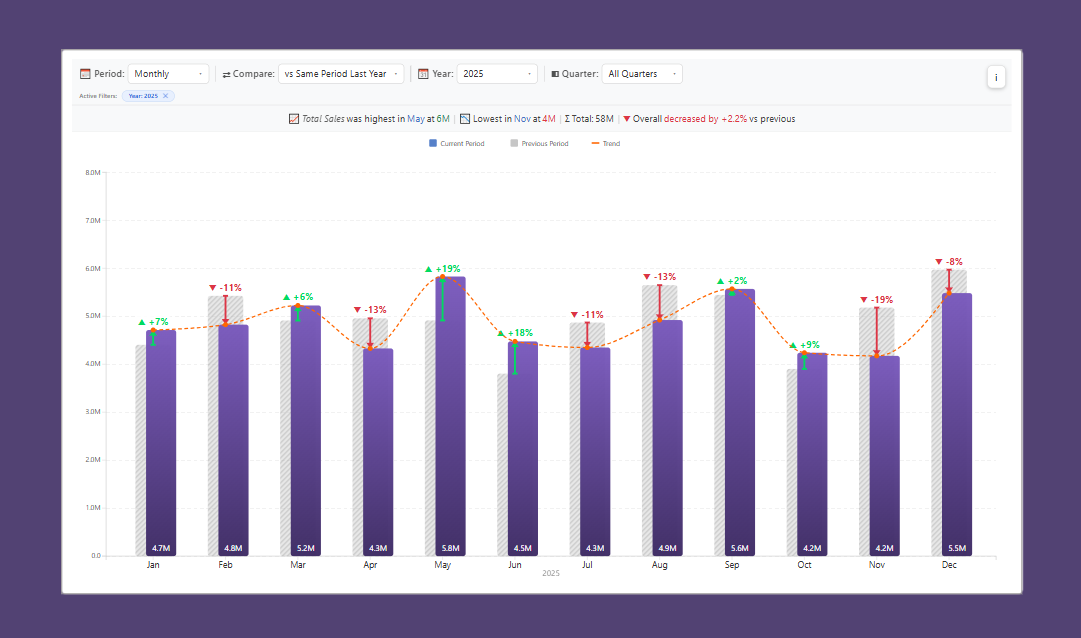
One custom Power BI visual that switches between Daily → Weekly → Monthly → Quarterly → Yearly with a dropdown. Compares vs Previous Period or Same Period Last Year. Auto-calculates YTD, CAGR, moving averages. All without writing a single measure.
🆓 100% free forever · ⚡ Instant download · 🔄 Free lifetime updates
If you've ever built a report, this hurts
Every Power BI developer knows this pain.
I've faced it on every. single. project.
Before vs After
Before
- Sales YoY = CALCULATE(...
- Sales MoM = CALCULATE(...
- Sales QoQ = CALCULATE(...
- Sales YTD = TOTALYTD(...
- Sales SPLY = CALCULATE(...
- Sales MA_3 = AVERAGEX(...
- ... × 41 more measures
- Then 6 separate visuals to display them.
After
- 1. Drop the visual on canvas
- 2. Drag a Date field
- 3. Drag a Measure field
- 4. Done.
Your users get 5 period views + 3 comparison modes + trends + running totals — with a dropdown they control themselves.
One visual. Nine superpowers.
5 Time Views
Daily · Weekly · Monthly · Quarterly · Yearly + YTD — switch with one dropdown.
3 Comparison Modes
No Comparison · vs Previous Period · vs Same Period Last Year.
Time Intelligence Built In
YTD, MTD, QTD, Running Total, Moving Average, CAGR — auto-calculated.
Interactive Filters
Year, Quarter, Month dropdowns live inside the visual — no slicers needed.
Trends & Error Bars
Trend line, moving average, % change arrows — all toggle-able.
Fully Customizable
Colors, fonts, borders, animations, gradients, patterns — 20+ format objects.
12 Animation Styles
Ease, bounce, elastic, back, cubic — animate bars, dots, lines with stagger.
Accessible
Keyboard nav, ARIA labels, screen reader support, high contrast mode.
Cross-Filtering
Click bars to filter other visuals. Multi-select with Ctrl+Click.
No mockups. This is the visual.
Change the period. Compare against last year. Toggle the trend line. Click a bar to cross-filter.
80+ features. Every one production-ready.
📅 Chart Types & Layout
- ✓Column (vertical) + Bar (horizontal) modes
- ✓3 comparison layouts: Side-by-Side, Overlapped, Ghost/Behind
- ✓Configurable bar spacing, corner radius, width %, overlap %
- ✓Previous-bar position: Left / Right / Behind
🎯 Interactive Control Bar
- ✓5 dropdowns embedded in the visual: Period, Compare, Year, Quarter, Month
- ✓Auto-visibility — dropdowns appear only when relevant to selected period
- ✓Active Filter Chips row with one-click clear
- ✓Auto-responsive — wraps to multiple rows on narrow visuals
- ✓Full styling: bg color, text color, accent color, font size, position (top/bottom)
- ✓Format-pane toggles to hide any individual filter
🧠 Smart Comparison Logic
- ✓Sequential comparison — each period vs immediately previous
- ✓Positional comparison — Week 1 of Feb vs Week 1 of Jan (when sub-period is filtered)
- ✓Weekly + Month filter → matches weeks by position
- ✓Daily + Quarter filter → matches days by position within quarter
- ✓Same-Period-Previous-Year for true YoY analysis
📊 Period Summary (Replaces Title)
- ✓📈 Highest value + period name
- ✓📉 Lowest value + period name
- ✓Σ Total across visible periods
- ✓x̄ Average (optional)
- ✓Overall % change vs previous
- ✓3 narrative styles: Full · Compact · Minimal
📈 Trend Line & Moving Average
- ✓Trend line over current period with animated drawing
- ✓Configurable moving-average window (any # of periods)
- ✓Line style, width, colors, dot size — fully customizable
- ✓Animated elastic pop-in for data points
📊 % Change & Error Bars
- ✓4 error-bar styles: Arrow (▲▼) · Line-with-Cap · Whisker · Bracket
- ✓Positive/negative colors, thickness, cap width
- ✓Label position: above bar · top of chart · on bar
- ✓Toggle to show absolute change instead of %
🏷️ Data Labels
- ✓4 positions: Outside End · Inside End · Inside Base · Inside Center
- ✓Show/hide previous-period labels
- ✓Optional background with transparency
- ✓Display units, decimal places, full font control
🎨 Bar Styling
- ✓Current bars: fill, opacity, gradient (start→end), shadow, border
- ✓Previous bars: same + pattern fills (diagonal, crosshatch, dots, horizontal)
📐 Axes & Legend
- ✓X and Y axis show/hide, title, font, color
- ✓Label rotation, word-wrap, max width
- ✓Grid lines: color, width, style (solid/dashed/dotted)
- ✓Y-axis: left/right, display units, decimal places, min/max range
- ✓Legend positions: 8 anchors, custom labels for current/previous
💬 Smart Tooltip
- ✓Auto-positions to stay within chart bounds
- ✓Shows: current, previous, % change, absolute change, YTD, running total, moving average, CAGR
- ✓Separate decimal settings for values vs percentages
🎬 Animation Engine
- ✓12 easing types: Linear · EaseIn · EaseOut · EaseInOut · Bounce · Elastic · Back · Cubic · Circle · Exponential · Polynomial · Sinusoidal
- ✓Stagger — bars animate one after another with configurable delay
- ✓Duration 100–3000ms
- ✓Drawing animation for lines · elastic pop-in for dots
🔀 Selection & Cross-Filtering
- ✓Click bars to cross-filter other visuals on the page
- ✓Multi-select with Ctrl+Click
- ✓Selection highlight with border color
- ✓Unselected bars dim to configurable opacity
- ✓Right-click context menu · click empty area to clear
♿ Accessibility & Robustness
- ✓Full keyboard navigation (Tab, Arrow, Enter, Space)
- ✓ARIA labels for screen readers · focus indicators
- ✓High-contrast mode support
- ✓Invalid date detection · empty data states · negative value support
- ✓Large number formatting (trillions+)
⚡ Performance
- ✓Data sampling for very large datasets
- ✓Animation limits on high-cardinality series
- ✓Optimised cross-filtering
- ✓ResizeObserver-based responsive layout
Built for every report that shows time
Sales performance
MoM, YoY, QoQ revenue tracking with drill-down by quarter or month — one visual, every view.
Contact-centre analytics
Call volume by day of week vs same week last year, with trend line and moving-average overlay.
Operations & production
Daily / weekly output vs previous period, with error bars flagging variance.
Retail & e-commerce
Same-store-sales YoY with pattern-filled previous-year bars for instant recognition.
Finance & banking
Running-total YTD alongside period-over-period % change in a single glance.
Marketing & CRO
Campaign performance week-over-week with active filter chips showing exactly what's applied.
Everything you need, nothing you don't.
The .pbiviz file
Ready to import into any Power BI Desktop or Service tenant.
Install guide
Step-by-step import + first-visual walkthrough. ~5 minutes to first chart.
Sample .pbix file
Fully configured demo report so you see every feature in action before touching your own data.
Free updates for life
Every new feature, every bug fix — automatically included, forever.
Email support
Direct line to me at dev@vizhawk.com. Reply within 24 hours.
Commercial licence
Free to use in unlimited client reports, for unlimited clients — no licence tiers, no seat limits.
Use this if you're…
- ✓ A Power BI developer shipping reports weekly
- ✓ Tired of maintaining dozens of time-intelligence DAX measures
- ✓ Building for stakeholders who keep asking to "switch the view"
- ✓ Delivering under Agile / sprint pressure and need to ship fast
- ✓ Done paying for third-party visual licence subscriptions
Skip this if you're…
- ✗ Only ever building 1-2 static reports a year
- ✗ Not allowed to install non-certified custom visuals
- ✗ Looking for a fully certified AppSource visual (this is direct-sold)
- ✗ Working exclusively in Excel / Tableau / Looker
No pricing tiers. No licence fees. Ever.
This visual is completely free — for personal projects, client work, and unlimited commercial reports. No subscriptions, no seat limits, no strings attached.
🔄 Free updates for life · ✉️ Free email support · 📜 Unlimited commercial use
Everything you need to know before installing
Still have a question? Visit our Support page or email dev@vizhawk.com
One visual. Every time comparison you'll ever need.
Stop writing time-intelligence measures. Start shipping reports faster.
100% free forever · Instant download · Free lifetime updates