Sport Injury Analysis Report
Sports Medicine / Athletics
Power BI Developer
Power BI Desktop, Power BI Service, Power Query (M), DAX, Power BI Visuals SDK
Sports medicine / athletic training injury tracking system, team roster system
🖼️ Project Gallery
30-Second Pitch
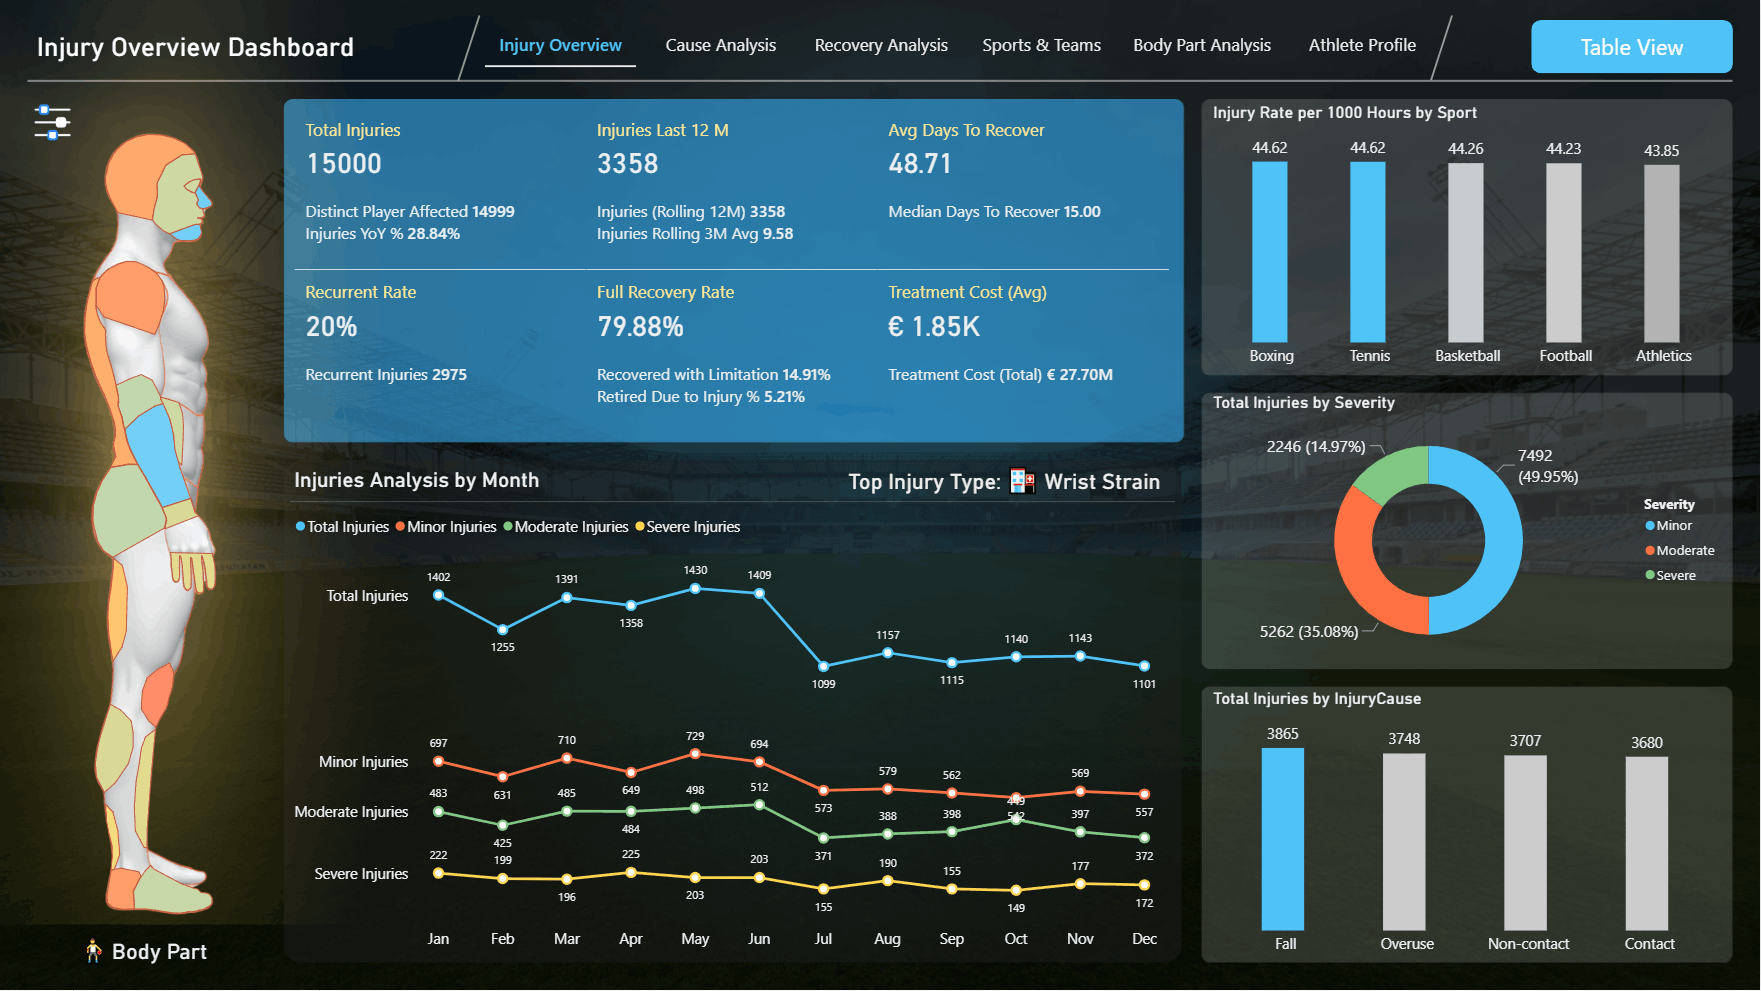
“Trainers wanted to see where injuries were clustering on the body, instantly. I built a fully custom, clickable human body map visual from scratch using the Visuals SDK — click a region, and the whole page filters to injuries there — plus pages for cause, treatment effectiveness, and team-level risk.”
The Situation
Athletic training staff logged injuries by body part, cause, treatment, and athlete in a tracking system, but had no fast, intuitive way to answer the question a trainer asks first: "where on the body are injuries actually clustering?" — that meant scanning tables and bar charts to reconstruct a mental picture that should have been visual from the start.
The Challenge
A standard bar or map visual couldn't represent "which body region" in a way that read instantly — the report needed a literal, interactive human body map that trainers could click on, alongside deeper analysis of injury cause, treatment effectiveness, team/sport patterns, and individual athlete history.
My Approach
I built the signature visual first, since it anchored the entire report's usability, then layered five supporting analysis pages around it.
Injury Overview Report — designed and built a fully custom, interactive human body shape visual using the Power BI Visuals SDK; clicking a body region cross-filters the entire page to injuries in that area, turning "where are injuries happening" into a two-second answer instead of a five-minute table scan.
Cause & Condition Analysis — broke down injuries by cause (contact, overuse, non-contact) and condition, helping training staff spot preventable patterns.
Recovery & Treatment Effectiveness — tracked recovery time and outcome by treatment type, letting medical staff see which interventions actually worked.
Team & Sports-Specific Profiler — compared injury rate and type across teams and sports, flagging which programs carried the highest injury risk.
Body Part and Injury Type Analysis — a tabular deep-dive complementing the body map, for anyone who needed the exact numbers behind the visual.
Athlete Profile — a single-athlete history view covering their full injury and recovery record, used by training staff for return-to-play decisions.
Result & Impact
Gave training staff an instantly readable view of injury clustering by body region, replacing manual table analysis.
Let medical staff evaluate treatment effectiveness by outcome rather than by instinct, informing future treatment protocol choices.
Flagged specific teams/sports with elevated injury rates, supporting targeted prevention programs.
Gave training staff a single-screen athlete injury history to support return-to-play decisions.