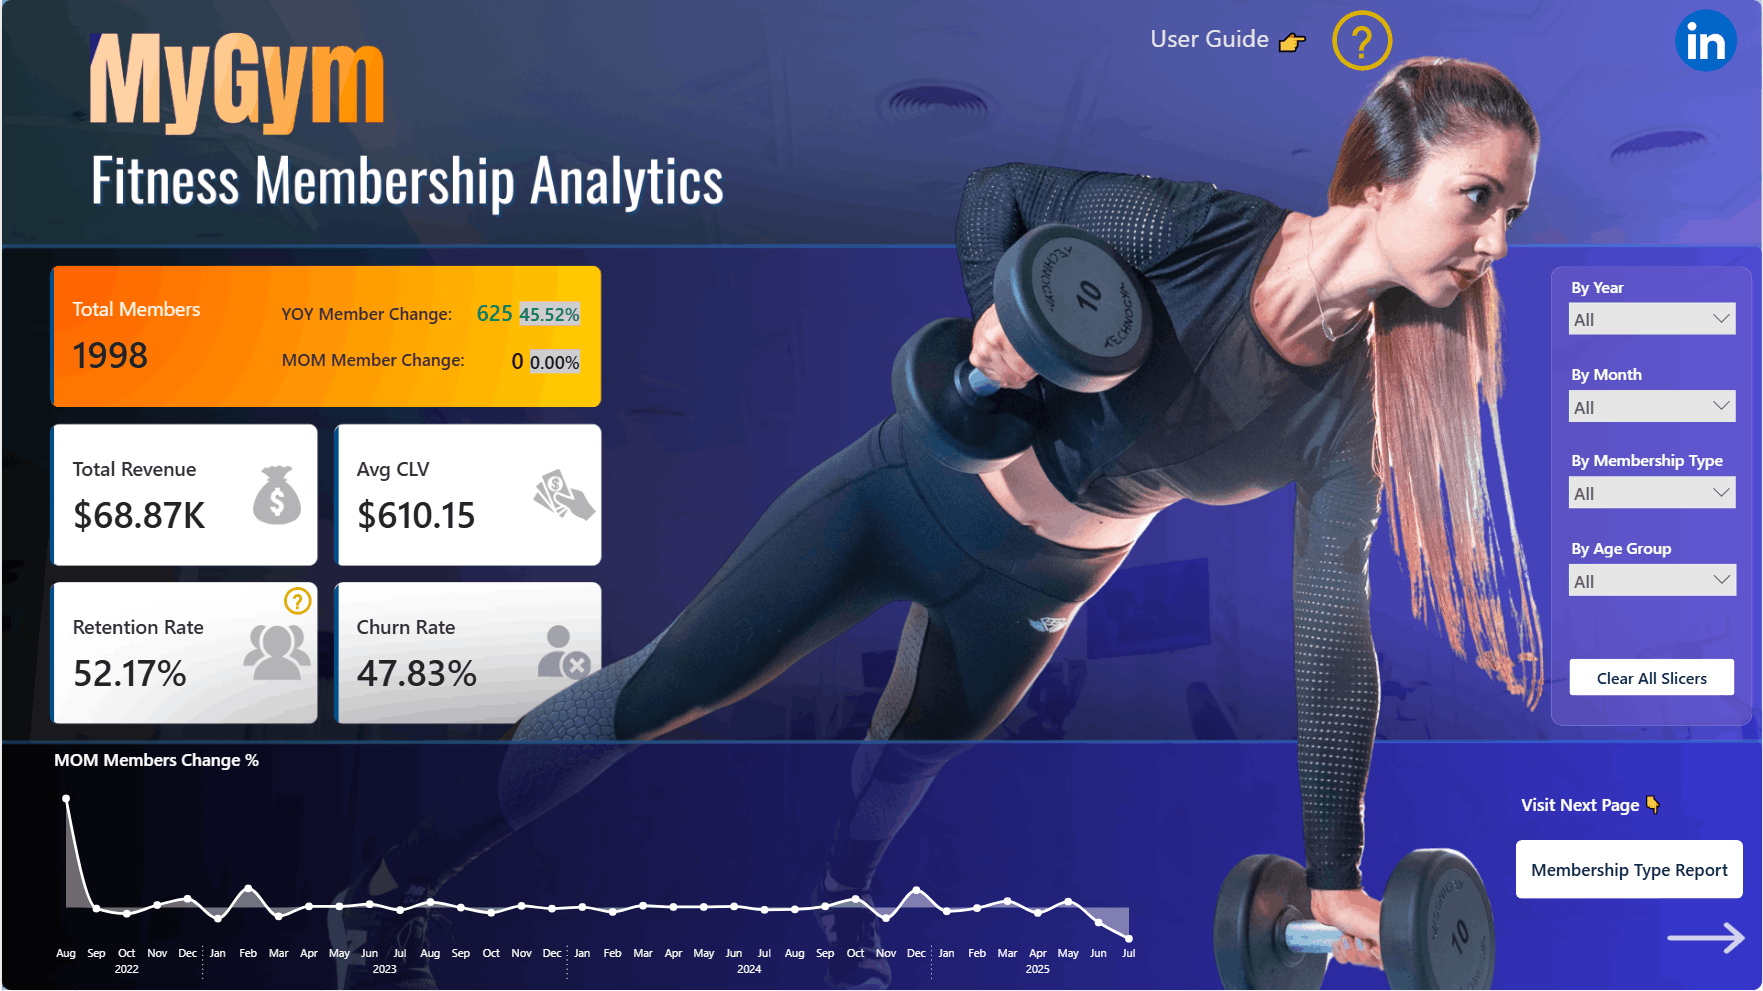
MyGym Fitness Membership Analysis
Fitness & Wellness — Multi-Location Gym Chain
Power BI Developer
Power BI Desktop, Power BI Service, Power Query (M), DAX
SQL Server, point-of-sale/billing, class and service booking system
🖼️ Project Gallery
30-Second Pitch
“MyGym could see membership numbers but not what was driving them. I built a seven-page report moving from overall health down to membership type, pricing, location, service usage, customer segments, and weekly traffic patterns — so every team could find their own answer in one place.”
The Situation
MyGym, a multi-location fitness chain, had membership, pricing, location, and class-usage data all sitting inside its membership platform, but no way to see which membership tiers, price points, or locations were actually driving profitable growth — every question required a different manual export.
The Challenge
Leadership had six distinct, related questions — is the business healthy overall, which membership types perform best, is the current pricing working, which locations deserve investment, which services actually keep members around, and who are the best customers — plus a seventh, more granular one: when do members actually show up during the week. Answering all seven in one coherent report, without seven disconnected tools, was the real ask.
My Approach
I built this as a seven-page report that moves from headline health down to increasingly specific business levers, so a reader can stop at whichever page answers their question.
Summary — headline KPIs on total membership, revenue, growth, and retention, giving leadership the 10-second health check.
Membership Type Performance — compared tiers on revenue, retention, and growth, exposing which membership types were quietly underperforming.
Pricing Model Impact — analysed price points against retention and revenue to find where pricing was helping vs. hurting membership growth.
Location Performance Analysis — compared gym locations head-to-head, giving leadership an evidence base for investment and closure decisions.
Services Usage Impact Analysis — connected class and service usage to retention, identifying which services were actually keeping members engaged.
Customer Segmentation Analysis — segmented the membership base so marketing could target retention and upsell campaigns by segment instead of blasting the whole list.
Weekly Usage Pattern — mapped facility usage by day and time, giving operations a staffing and capacity-planning tool.
Result & Impact
Gave leadership a single report answering membership health, pricing, location, and service questions that previously required manual exports across four business functions.
Identified specific underperforming membership tiers and price points instead of relying on gut feel.
Gave operations a weekly usage pattern view to align staffing with actual member traffic.