Marathon Report - Every Runner's Story, One Card Away
Sports & Events — Endurance Racing
Power BI Developer
Power BI Desktop, Power BI Service, DAX, Power BI Visuals SDK
SQL Server
🖼️ Project Gallery
30-Second Pitch
“The results data was there but static. I built a interactive KPI visual where clicking any time-category card filters the whole stats page to that segment, plus a polished athlete profile card pulling together someone's full marathon history in one shareable view.”
The Situation
Marathon organisers had finish-time data broken out by every category — age group, gender, distance — but it sat in flat tables. Staff and athletes had no way to explore results interactively, and there was no clean, presentation-ready way to look up a single athlete's full race history.
The Challenge
Static KPI cards weren't enough — organisers wanted the stats page itself to be an exploration tool, where clicking a category's average-time KPI would filter the whole page to that segment, and they wanted a genuinely polished, shareable profile card for individual athletes rather than a table row.
My Approach
I designed both pages around interaction rather than static display, since the value of race data is in exploring it, not just reading it once.
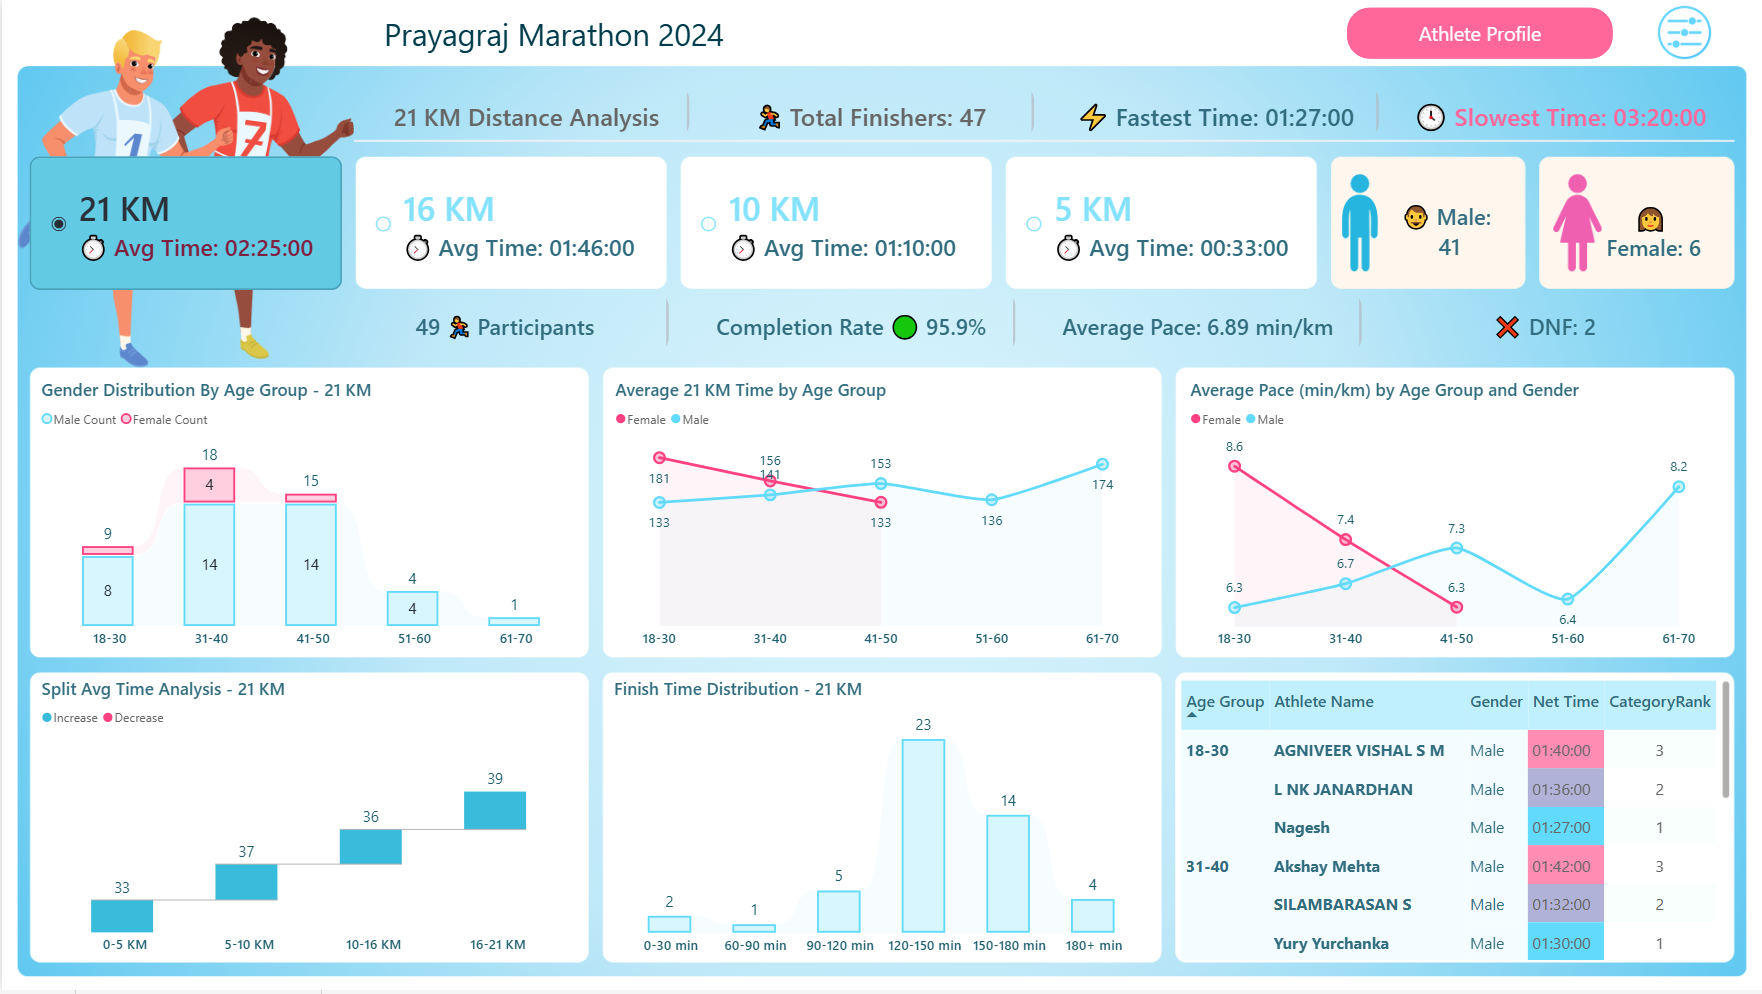
Marathon Stats page — built a fully custom, interactive KPI visual for every time category showing average finish time, where clicking any category KPI cross-filters every other visual on the page to that segment — turning the stats page into a live exploration tool instead of a fixed report.
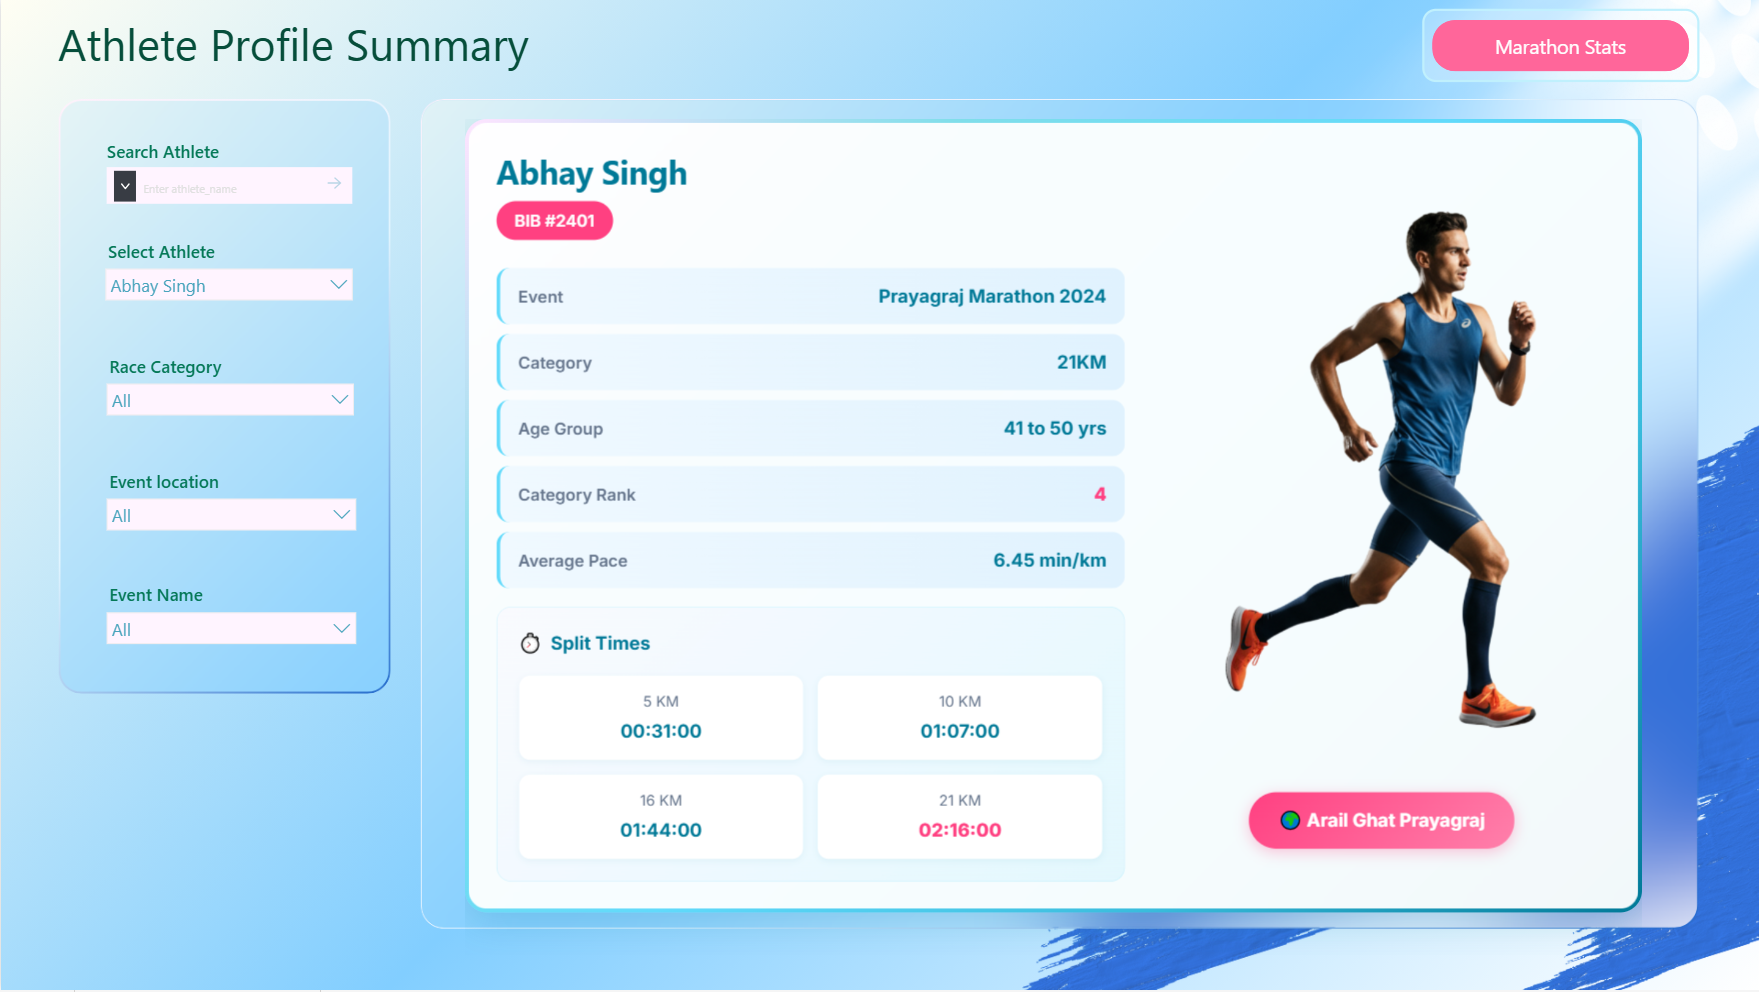
Athlete Profile page — designed a single, polished performance card per athlete, pulling together their full marathon history, personal bests, and race details into one presentation-quality view, built to be shareable with the athlete or press without any further formatting.
Result & Impact
Turned a static results table into an interactive exploration tool — staff could click straight from a category KPI into that segment's full detail.
Gave organisers a shareable, presentation-ready athlete profile card usable directly for athlete recognition or press purposes, with no manual rebuilding.