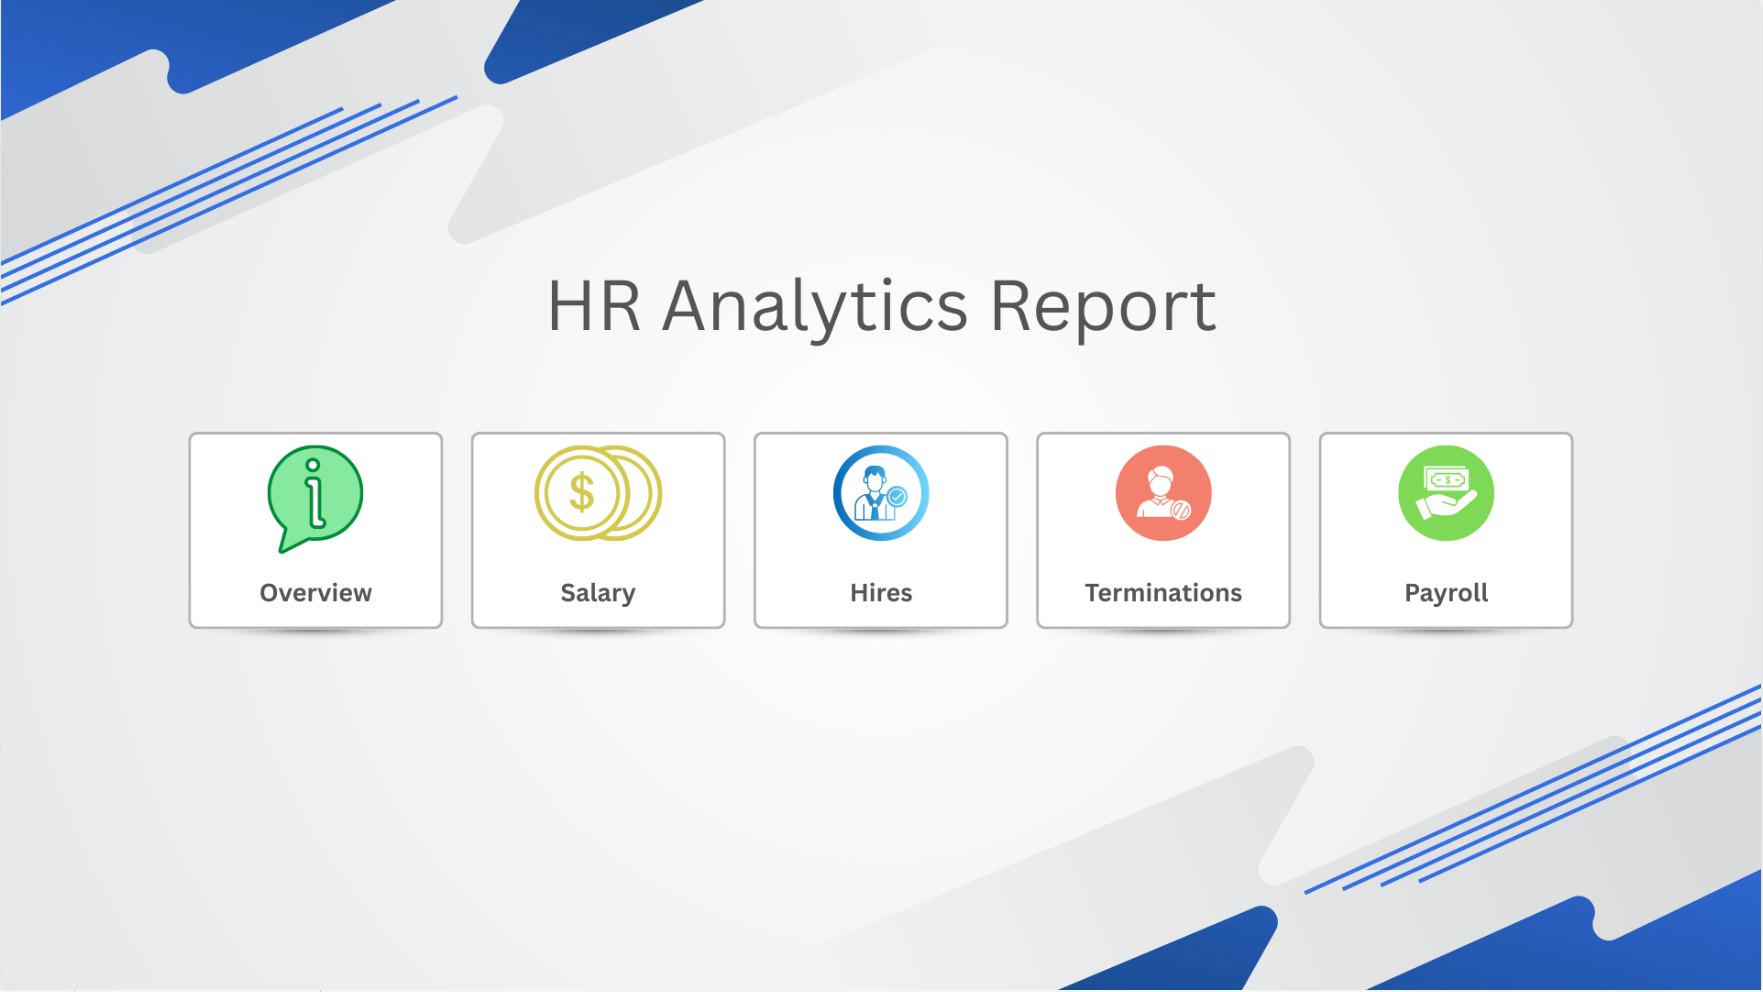
HR Analytics Report - Connecting the Dots Between Hires, Pay & Exits
Human Resources — Workforce Analytics
Power BI Developer
Power BI Desktop, Power BI Service, Power Query (M), DAX
Excel/CSV, Payroll system
🖼️ Project Gallery
30-Second Pitch
“HR had headcount, salary, hiring, and termination data, but never side by side over time. I built six pages ending in a comparison view that trends all three together, so leadership can finally see when a hiring slowdown and a termination spike are actually connected.”
The Situation
HR was tracking headcount, salary, hiring, and termination figures manually each month across separate spreadsheets, with no connected view of how these metrics moved together over time — so a spike in terminations and a slowdown in hiring in the same quarter could easily go unnoticed.
The Challenge
HR needed both a monthly operational snapshot (headcount, hire rate, termination rate) and the ability to see salary, hiring, and termination trends side by side over time, rather than three separate charts that no one had time to cross-reference manually.
My Approach
I built a six-page report progressing from a single overview to focused deep-dives, ending in a trend-comparison page purpose-built to connect the dots between them.
Overview — headcount, salary, hires, terminations, hire rate, and termination rate as the single monthly snapshot for HR leadership.
Salary Analysis — salary distribution and trends by department, role, and tenure, surfacing pay equity and budget questions.
Hire Analysis — hiring volume and rate by department, source, and time-to-fill, giving talent acquisition a performance view.
Termination Analysis — termination volume and rate by department and reason, isolating voluntary vs. involuntary attrition.
Payroll Analysis — payroll cost trends reconciled against headcount, catching discrepancies between what HR expected to pay and what payroll actually processed.
Comparison Report — trended salary, hires, and terminations together over time on one page, so HR could finally see, for example, whether a hiring slowdown coincided with a termination spike.
Result & Impact
Replaced manual month-end spreadsheet compilation with a live, self-service report.
Let HR leadership catch termination-rate spikes and correlate them against hiring and salary trends in the same view, instead of after the fact.
Reconciled payroll cost against headcount, surfacing discrepancies that had previously gone unnoticed until month-end close.