Hospital Admission Analysis - Untangling Encounters, Admissions & Procedures
Healthcare — Hospital Operations
Power BI Developer
Power BI Desktop, Power BI Service, Power Query (M), DAX
Hospital Admission/Discharge/Transfer (ADT) system, EHR
🖼️ Project Gallery
30-Second Pitch
“Their admissions, encounters, and procedures were all getting blended into one confusing set of numbers. I split it into three properly-scoped pages — non-admission encounters, admissions and readmissions, and procedures — so every metric actually meant what people thought it meant.”
The Situation
A hospital's operations team was reporting on encounters, admissions, and procedures as one blended dataset, which made it impossible to answer basic questions cleanly — like whether a rise in "visits" meant more outpatient walk-ins or more actual admissions, or what the real 30-day readmission rate was once non-admission encounters were correctly excluded.
The Challenge
Encounters, admissions/readmissions, and procedures each have different definitions, different denominators, and different stakeholders — mixing them together in one metric produces numbers that are technically calculable but operationally meaningless. The report needed to cleanly separate these three questions while still living in one connected model.
My Approach
I split the report into three purpose-built pages, each with its own correctly-scoped metric definitions agreed with clinical operations stakeholders before building a single visual.
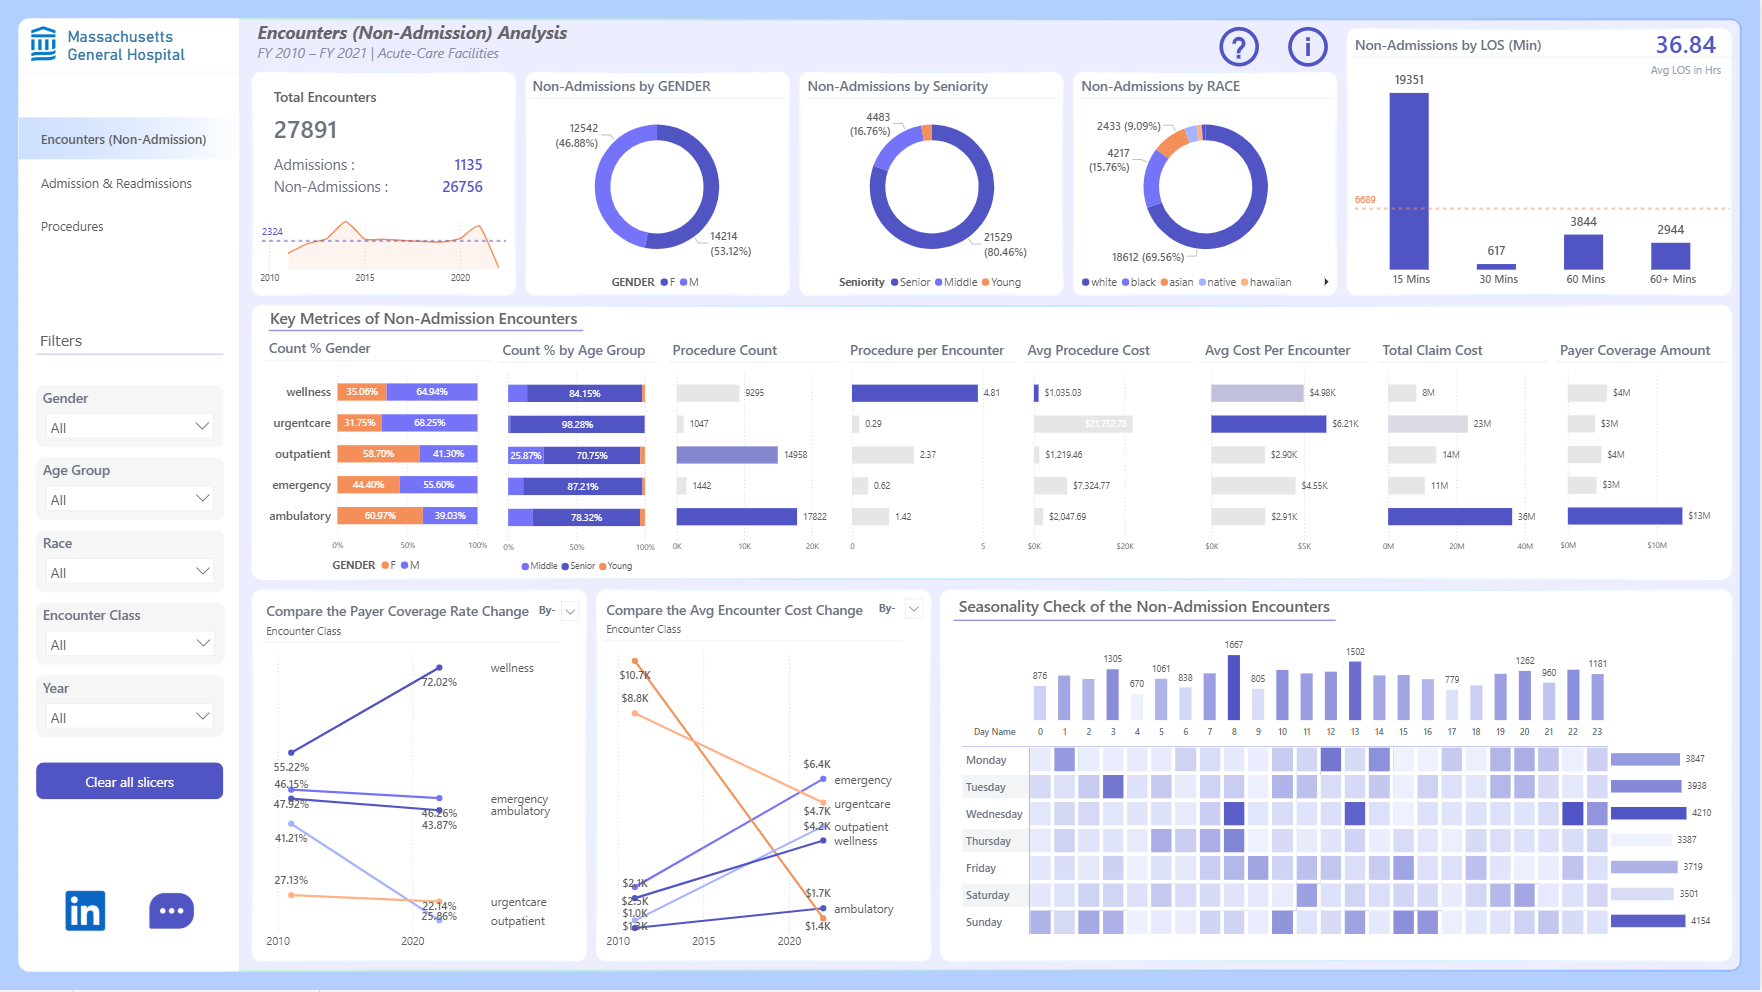
Encounters (Non-Admission) Analysis — covered outpatient and non-admission encounter volume and trends by department, encounter type, and reason for visit, isolated from anything that resulted in an actual admission.
Admission & Readmission Analysis — covered admission volume, average length of stay, and readmission rate (including 30-day readmission), broken down by department and diagnosis, using a precisely-defined DAX measure so the readmission rate held up under clinical scrutiny.
Procedure Analysis — covered procedure volume, type, associated cost, and outcome, giving resource planning teams a clear view of surgical and procedural throughput independent of the admission and encounter numbers.
Result & Impact
Gave hospital operations a clean separation between outpatient encounters and true admissions for the first time — ending a recurring definitional dispute between departments.
Delivered a readmission rate calculation that clinical leadership could trust and benchmark against, since the denominator was correctly scoped.
Gave resource planning a procedure-level cost and volume view to support staffing and equipment decisions.