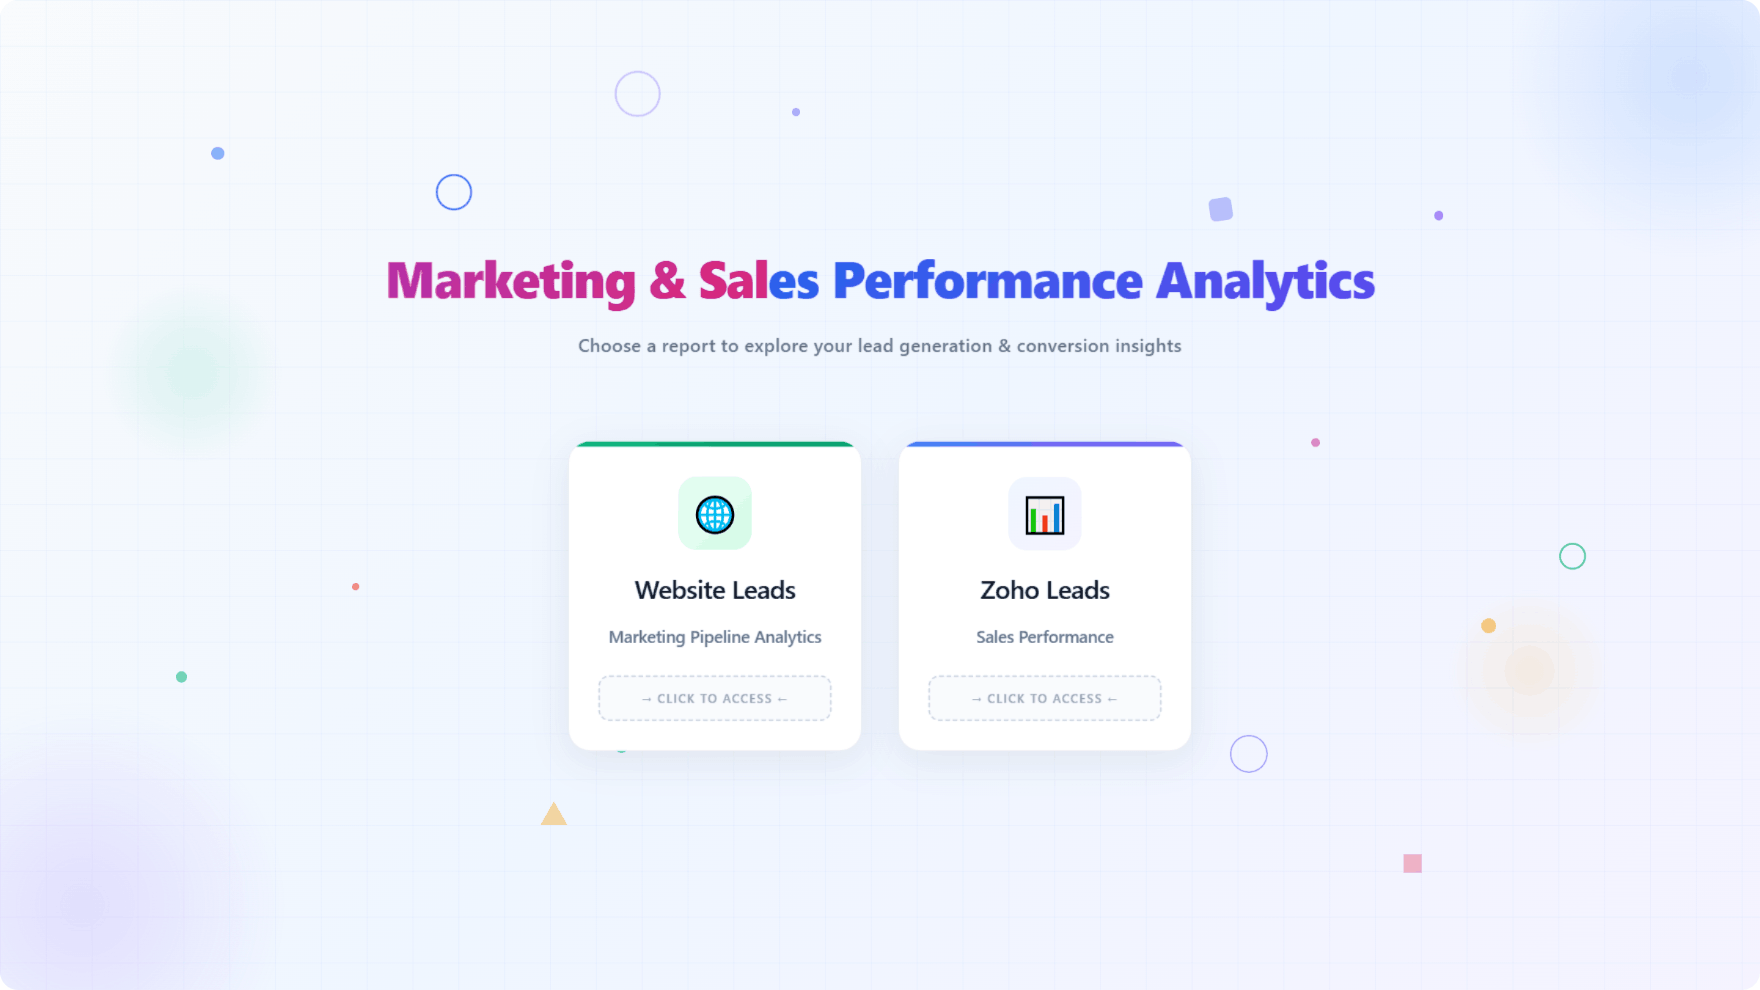
Company Marketing & Sales Performance Report
B2B Marketing & Sales
Power BI Developer
Power BI Desktop, Power BI Service, Power Query (M), DAX, Power BI Visuals SDK, HTML/CSS custom visuals
ZOHO CRM (leads API), Excel
🖼️ Project Gallery
30-Second Pitch
“Marketing and sales data lived in two different systems with no shared funnel view. I unified them into one model, built a custom HTML funnel visual for the executive view, and built a fully custom time-intelligence visual from the ground up so leadership could compare every lead type's trend in one place.”
The Situation
Marketing tracked leads in its automation platform and sales tracked opportunities in the CRM, so leadership never had one continuous view of a lead's journey from first touch to closed-won or closed-lost — every board update meant manually stitching two exports together.
The Challenge
Beyond just unifying the data, leadership wanted the funnel itself to be visually compelling enough for executive presentations — a real funnel shape, not a stacked bar chart standing in for one — and wanted to compare every lead type against every other one across time, which native Power BI time-intelligence visuals couldn't cleanly show in a single view.
My Approach
I unified marketing and sales data into one funnel-stage model, then went beyond out-of-the-box visuals twice — once for the funnel itself, once for time comparison — because the standard visual gallery couldn't deliver what leadership actually needed to see.
Executive Summary — total leads, Marketing Qualified Leads (MQL), Sales Qualified Leads (SQL), Won, and Lost as the headline KPI strip, giving leadership the funnel's shape at a glance.
Lead Funnel Analysis — designed and built a fully custom HTML/CSS funnel visual inside Power BI, rendering a true tapering funnel shape with stage-by-stage conversion, since the native funnel visual couldn't match the client's brand and detail requirements.
Leads Table — a detailed, drillable table for anyone who needed to go from the funnel straight down to individual lead records.
Time Comparison Analysis — built a fully custom time-intelligence visual using the Power BI Visuals SDK, comparing every lead type (MQL, SQL, Won, Lost) against every other one across time periods in a single connected view, rather than switching between four separate trend charts.
Result & Impact
Gave marketing and sales leadership one funnel view spanning first touch to closed deal for the first time, replacing manual export-stitching.
The custom HTML funnel visual became the report's signature executive-facing view, used directly in leadership presentations.
The custom time-intelligence visual let leadership compare all lead types' trends side by side in one view, instead of reading four separate charts and mentally cross-referencing them.